Total sales can grow because many new customers arrive, even while fewer existing customers return. Looking only at this month's revenue can hide how much effort is required to replace the previous customer base.
Before launching coupons or a loyalty scheme, establish whether the data recognises the same person across channels, what kind of repeat purchasing is being measured and whether customers have had enough time to return.
Check whether the same customer is recognised consistently
One person might buy through the website, a chat conversation and a physical shop with different identifying information. If each transaction creates a new customer record, reported acquisition rises and repeat purchasing falls without an equivalent change in actual behaviour.
Choose identifiers and matching rules that fit the available data. Examine shared accounts, changed phone numbers and guest orders. Similar names alone are not enough to combine people, because a false match can mix unrelated purchase histories.
Retain links to the original records and a history of merges so incorrect matches can be reversed. Use only the information needed and restrict access to personal details. An overview report does not need to display every customer's contact information.
Choose a measure that answers the intended question
“Repeat purchase rate” can refer to different calculations. One report may count this month's buyers who have bought previously; another may follow first-time buyers from a particular month to see whether they return within a defined interval. State the numerator, denominator and observation window.
| Question | Useful measure | Interpretation to check |
|---|---|---|
| Who generated this month's sales? | Revenue from new and existing buyers | When existing-customer status is determined |
| Do new customers return? | Share purchasing again within a defined interval | Equal time to observe each group |
| How often do they return? | Purchase counts and time between purchases | Different product replacement cycles |
| Is repeat purchasing worthwhile? | Value after the relevant deductions under the agreed definition | Different discounts and servicing costs |
Apply explicit rules to cancelled, fully returned and test orders. If partially returned orders still count as purchases, use that treatment consistently. Keep both order counts and the defined net-value measure available.
Give each group the same opportunity to return
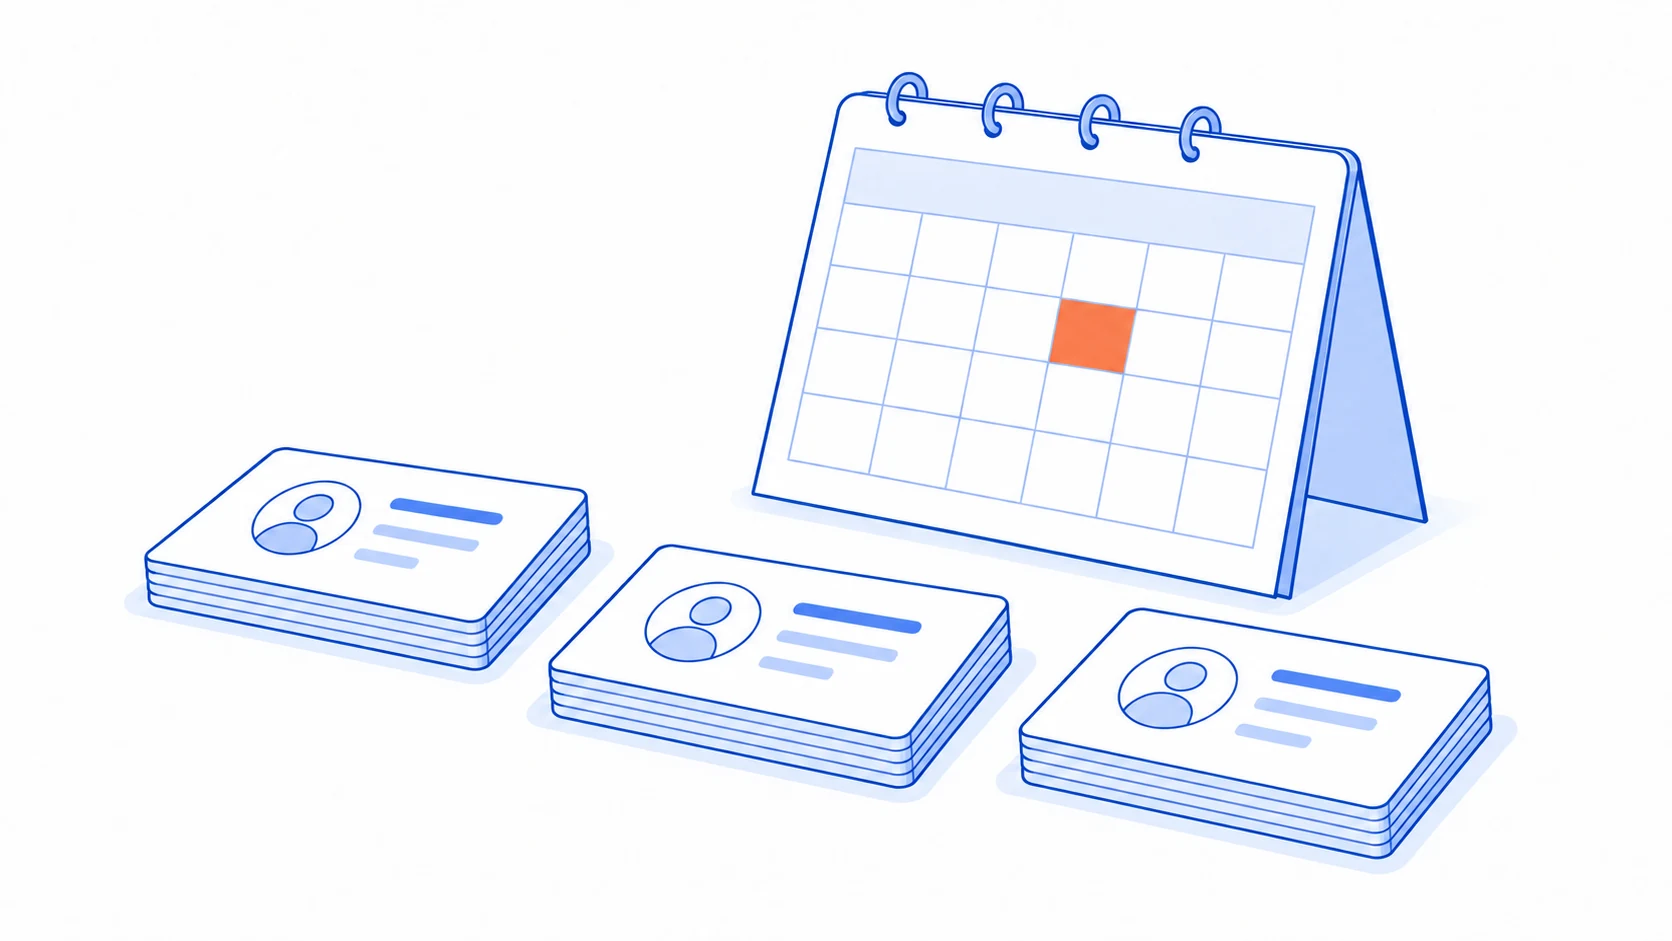
Grouping customers by their first-purchase period, often called a cohort, separates acquisition growth from later behaviour. It allows a comparison of what different groups do after the same amount of time has elapsed.
Shopify's customer-report documentation describes grouping by first purchase and following subsequent intervals. This illustrates how repeat behaviour can be examined without mixing every customer generation into one total.
Do not compare someone who first purchased last week with a long-established customer as though both have completed the same observation window. Mark immature periods as not yet fully observed instead of interpreting them as a failure to return.
Product cycles also matter. Consumables and products designed to last for years should not have the same expected purchase frequency. A customer who does not buy the original item again might return for accessories or maintenance instead.
Investigate the change, then examine the actual experience
When a group appears less likely to return, investigate its first product, acquisition channel, delivery experience or exposure to stock shortages. Change one comparison dimension at a time where practical so the difference remains interpretable.
A relationship alone does not prove that a promotion or channel caused the change. Customers acquired during a campaign may have bought different products or had different needs. Small groups can also fluctuate enough to make an immediate decision premature.
Compare the questions raised by the numbers with return reasons, complaints and customer-service observations. If customers are not returning because products are unavailable or support is poor, another promotional message may leave the underlying problem untouched.
Check whether the comparison crosses a change in data collection. A newly connected sales channel or a revised customer-matching rule can improve apparent retention without any change in the experience. Annotate such changes before interpreting a trend.
Turn the finding into something that can be tested
Choose an evidence-backed problem and a measurable change: clearer pre-purchase information, better usage guidance, or availability of products existing customers need. Define the group, observation period and decision criteria before starting.
Track return behaviour alongside value, refunds and the team's workload. A promotion that increases repeat orders may still miss the business objective if it requires unsustainable discounts or service effort.
Where customer identities remain fragmented, start with connecting LINE OA and a CRM. Combine the numbers with customer-feedback analysis to identify which part of the experience deserves attention before adding more marketing activity.
Are growing sales hiding a constant need to replace customers?
Talvyn Labs can connect customer and order histories, analyse repeat purchasing and build reporting that supports practical retention decisions.
Understand your repeat customers